About this Article
This article provides information about Dashboard features and how to customize the displayed tiles, widgets, application and host information.
The Dashboard is the home page displayed when a user logs into CMS. The panel has tiles and widgets that show real-time snapshots of the secured applications, detected threats and attacks along with various trends. The dashboard is configurable for each user.
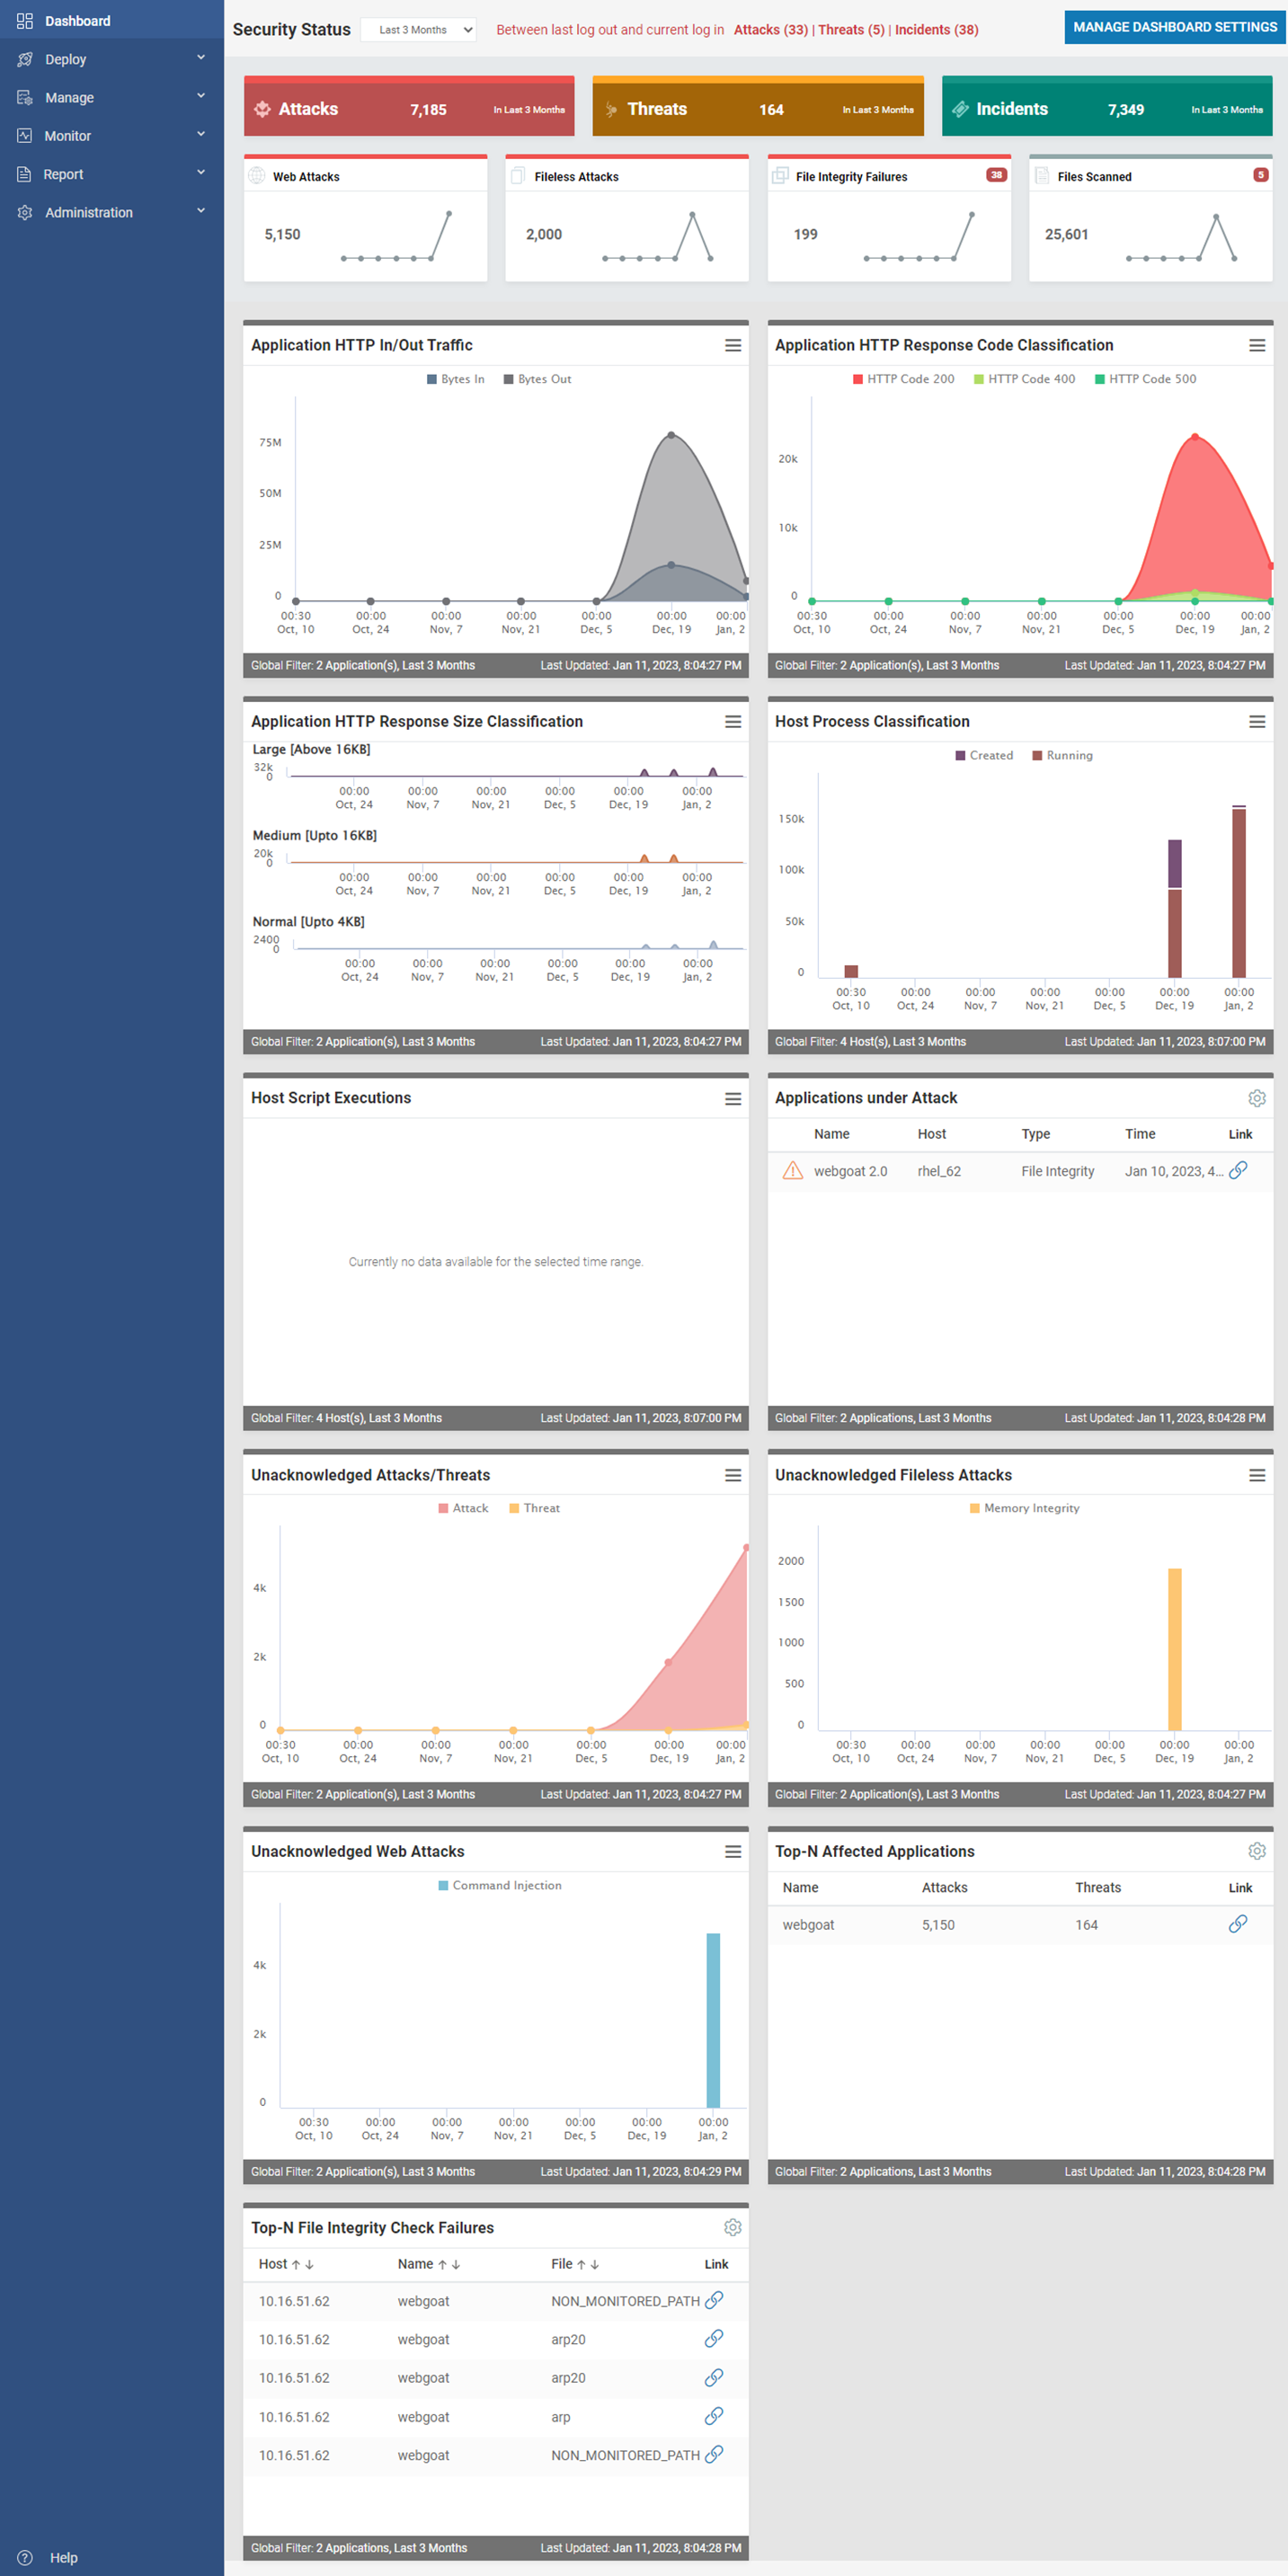
- The dashboard displays Attack, Threat and Incident counts since the last login as well as their numbers for previous configurable duration in hours. The number of incidents is always the same as the total number of notifications, threats and attacks
- A click on any count on the Tile will display the incidents page with relevant incidents listed
- The time frame for which the statistics of the dashboard should match is also configurable
- Recent notifications count is displayed on the top of the screen as a bell icon. A click on this icon displays both the System Notifications and Recent Incidents. A click navigates the user to the specific page. An option to mark all the notifications as read is also provided
- Different Widgets are displayed in the later part of the dashboard to provide a holistic view of the configured applications and incidents
- On mouse-over, the Widgets display specific information like attack detection time
- Each Widget can be configured individually
- Click on Settings link associated with the Widget to view in full screen mode or to modify the local settings
- Zoom into a specific interval in a displayed Widget by selecting the required section
- Navigate to Help > About Virsec CMS to view the release version details
Configure Dashboard
- Click Manage Dashboard Settings on the Dashboard page
- Configure Tiles
- Tiles represent the trend in increase/decrease of a specific incident with time. Select all the Tiles that need to be shown on the Dashboard. The below table depicts the various Tiles that are available for selection
Attack/Violation Description Web Attacks Depicts the number of Web Attacks Fileless Attacks Depicts the number of Fileless Attacks File Integrity Failures Depicts the number of File Integrity Failures Files Scanned Depicts the number of Files Scanned App Control Violation Depicts the number of ACP (App Control Policy) violations - The order in which the Tiles are displayed on the dashboard can also be configured
- Tiles represent the trend in increase/decrease of a specific incident with time. Select all the Tiles that need to be shown on the Dashboard. The below table depicts the various Tiles that are available for selection
- Configure Widgets
- Select all the Widgets that need to be displayed on the Dashboard
- The order in which the Widgets are displayed on the dashboard can also be configured
- Configure Applications
- Select the Applications for which statistics must be displayed on the Dashboard
- Configure Hosts
- Select the Hosts for which statistics must be displayed on the Dashboard
- Time Range
- Select the default Time Range for all the Tiles, Widgets and Alerts to be displayed on the dashboard. Click APPLY CHANGES