About this Article
This article provides information about all the option available under Monitor section including how to list incidents, incident history, system alerts, Probes and Application logs.
[Version 3.1.0 and Below]
Dashboard Overview
This is the second dashboard provided by the CMS
Navigate to Monitor > Overview in the left navigation pane
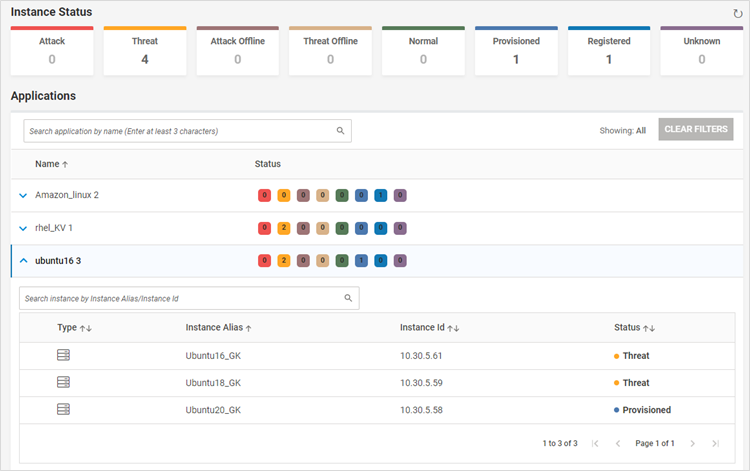
This dashboard provides an overview of the applications in different statuses and instances associated with each application
The count of applications in each status is provided
The page also displays information about each application and the instances associated with it (both AE and probes)
A click on each status filters the displayed applications for that status
Deploy Overview
This page provides information about the installed Remote vRule Engine instances and Location information
Navigate to Deploy > Overview
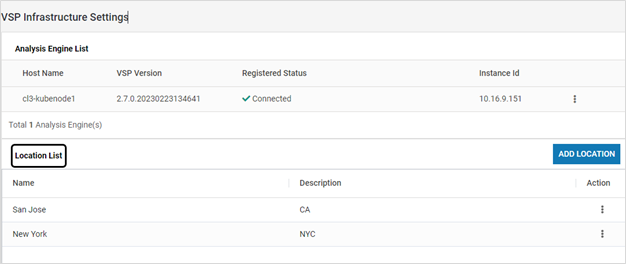
Remote vRule Engines/ Analysis Engine List
All the available Remote vRule Engines are listed
These instances are automatically listed once they register with CMS post-installation along with their status
Add and modify actions are not available. They can only be deleted
Location List
Locations are listed in the page
To add a new entry, click ADD LOCATION. Provide the required information. Click SAVE
Probes
Probes page provides a holistic view of VSP Probe. All the required information related to a Probe is displayed in a single place
Navigate to Deploy > Probes
All the Probe instance are listed with information regarding Attacks, Threats, Status, Version, Monitoring Mode and Application Count are displayed
A click on a particular host displays more information about it. Toggle between Host Monitoring and Application Details to view the required information
A click on Attacks or Threats count list all the detected Attacks/Threats in a separate tab
A search option to filter the Probes based on the name is provided
To view the Archived Nodes, select Show Archived Nodes
Select the required columns to be displayed on the page using Columns icon in the right end
To export the information displayed on the page:
Select the required Probes. Click Export in the right end
Select the required option- Export all or Export selected
Click YES on the confirmation screen
The information is downloaded as a Microsoft Excel file to the local system
To modify the information related to a probe, click Edit corresponding to that probe
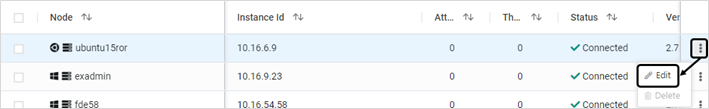
Modify the Host Name and Location as required. Click SAVE
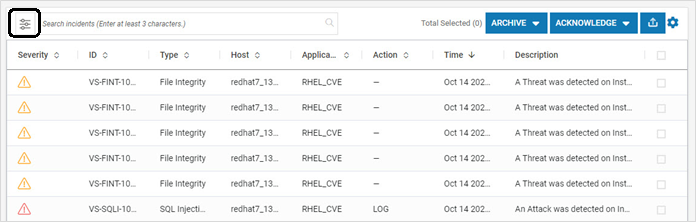
Incidents
Navigate to Monitor > Incidents in the left navigation pane
The Incidents page displays information of all threats and attacks.
The severity depicts whether the entry is an attack (red), a threat (orange) or a notification (blue)
Each Incident ID provides information about Attack Type and date when Incident was reported
Click on the Incident to view more information
The tabs – Incident Details, Protection Actions and Extended Properties provide information about the incident
The incident can be added, acknowledged, archived OR exported in Microsoft Excel and PDF formats. A Web incident can also be added as an exception (if such incident is not desired)
Select all the required incidents, expand ACKNOWLEDGE
Acknowledge only the selected incidents or all the listed incidents
Once acknowledged, the incident are not displayed on the page
Select all the required incidents, expand ARCHIVE
Archive only the selected incidents or all the listed incidents
Incidents are auto-archived after a maximum count of 500K is reached
A basic or an advanced search can be performed on the displayed incidents
Version 2.11 and Above:
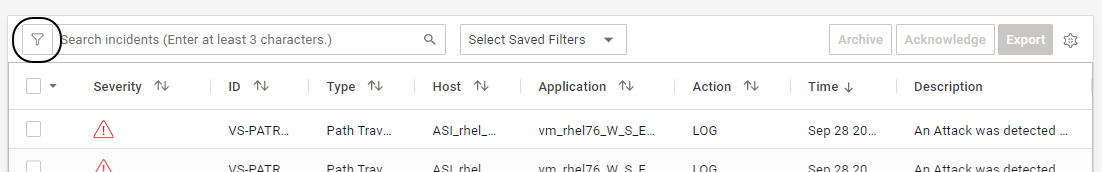
Incidents can also be filtered based on search criteria. A user can create a maximum of ten filters. Filters created by one user cannot be viewed by another user
Search can be performed based on - Severity, Application, Category, Type, Status, Action, Date Range and Hosts (Included/Excluded)
The selected filters can be saved and utilized to view only the required incidents from the list. The filters can also be deleted or search criteria can be modified. A new filter can also be created with the existing filter as a template using the Save As option
Once a filter is selected, it is applicable to Archive, Acknowledge and Export functionalities
Version 2.10 and Below:
Incidents can also be filtered based on the criteria - Severity, Application, Category, Type, Status, Action and Date Range
All the Timestamp values can be viewed in one of the three time zones – UTC Time, Host (Probe) Time and Local (browser) Time
To set the time zone, click Incident Settings icon
Select the required time zone. Click APPLY
The time zone is configurable for each CMS user. Once selected, the time values are displayed in same time zone until modified
By default, Local Time is set as the time zone for each newly created user
Multiple Incidents can be exported into a Microsoft Excel Worksheet
To export the VSP incidents, select all the required incidents, expand Export icon
Select the required option – Selected Incidents or All Incidents
Click YES on the confirmation screen
The incidents are downloaded as an excel file on the local machine
Incident History
The Incidents History page displays threat and attack information discovered before three months’ time or manually archived by the user from the Incidents page
Navigate to Monitor > Incident History in the left navigation pane
Expand each incident to view more information
System Alerts
System Alerts page displays all the alerts related to user management, application securing, Probe association and changes in AE/Probe status. All users can customize the system alerts as required. These alerts are also sent to the Syslog server (if configured). To view the System Alerts, follow the below steps
Navigate to Monitor > System Alerts in the left navigation pane
All system notifications are listed with the Severity, Type, Time, Module and Description. The notifications can be filtered based on the Type
Click on any notification to view more information
Application Logs
Navigate to Monitor > Application Logs in the left navigation pane to view the log information
Software Exception Logs and Class Load Logs) for a defined timeframe as well as export them to a Microsoft Excel spreadsheet:
Select the appropriate Application Name, Executable Context Path, Business Transaction Log and Application Log Type as Software Exception Logs or Class Load Logs
Details of the software exceptions are displayed with the request information (Date, HTTP Transaction, Exception Name, Declaring Class, File Name, Method, Line Number and Error Message)
Use Export to Excel to export the displayed data to a Microsoft Excel spreadsheet