CMS Troubleshooting
- 09 Nov 2023
- 7 Minutes to read
- Print
- DarkLight
- PDF
CMS Troubleshooting
- Updated on 09 Nov 2023
- 7 Minutes to read
- Print
- DarkLight
- PDF
Article summary
Did you find this summary helpful?
Thank you for your feedback!
About this Article
This article lists the common issues encountered in CMS, their possible causes and recommended work around.
Common Commands
VM
- Move to the directory containing CMS-related scripts using the below command:
cd <CMS_Installation_Directory>/docker-compose-files - Execute the below command to view the status of CMS Services
./status.sh - Execute the below command to start the CMS Services
./start.sh - Execute the below command to stop the CMS Services
./stop.sh
Kubernetes
- Execute the below command to verify the CMS Pods
kubectl get pod –n virsec - Execute the below command to verify the CMS Services
kubectl get svc -n virsec - Execute the below command to verify the status all deployments and replicas
kubectl get all -n virsec
Error During CMS Installation
Symptom: “ERROR: Failed to run command” encountered during CMS installation on hardened OVA
Recommended Actions: Do not use “sudo” with any script executed during CMS installation
- Wrong Usage Example:
- sudo ./setup.sh -f small -k 0 <CMS_IP_ADDRESS>
- Correct Usage Example:
- sudo bash
- ./setup.sh -f small -k 0 <CMS_IP_ADDRESS>
Unable to download latest script for installation
Symptom: Unable to download the latest script used for installation. An error of incorrect path may also be displayed
Possible Cause: Browser used to access LFR may download previously cached files
Recommended Actions: Ensure that the cache is cleared from the browser or utilize the Incognito mode
Unable to log into CMS UI after installation
Symptom: Unable to log into CMS after installation
Possible Causes: The worker node with the Authentication service pod installed is not in the same time zone OR time as the Master Node.
Recommended Actions: Change the time zone or time of the worker node to that of the Master Node.
- Execute the command below to check the time zone
timedatectl - If there is a time zone difference between the master and the worker nodes, execute the below commands:
timedatectl set-timezone <Timezone> #To modify the Time Zone systemctl restart systemd-timedated.service # To restart the timedate service - If there is a time difference between the master and the worker nodes, execute the below commands:
timedatectl set-time hh:mm:ss    #To modify the time
systemctl restart systemd-timedated.service  #To restart the timedate service
Unable to access CMS after upgrade
Symptom: After a VSP CMS upgrade, user is unable to access CMS. Error 400 is displayed on the browser
Possible Causes: User was logged in during CMS upgrade process
Recommended Actions: Ensure that the cookies are cleared from the browser
Provisioning Fails after CMS Upgrade
Symptom: Provisioning fails after VSP CMS Upgrade
Possible Causes: CMS takes time to start completely during the upgrade since it takes time to download the required images in the background
Recommended Actions: Stop and start CMS after every upgrade to overcome the delay caused by images download
Services vsp-cms-reports and vsp-jreports in Pending status
Symptom: Services vsp-cms-reports and vsp-jreports are in Pending status after Upgrade
Recommended Actions: Follow the steps below:
- Check the statuses of the services jreports-content-claim and jreports-database-claimusing the commands below:
kubectl get pvc -n virsec | grep jreport kubectl get pv -n virsec | grep jreport - Delete both the JReports using the below commands:
./vsp_deploy_cms.sh -p   #To stop the Optional Services
kubectl delete pvc jreports-content-claim -n virsec
kubectl delete pvc jreports-database-claim -n virsec
kubectl delete pv jreports-content -n virsec
kubectl delete pv jreports-database -n virsec
kubectl get pvc -n virsec | grep jreport    #To verify the status
kubectl get pv -n virsec | grep jreport
./vsp_deploy_cms.sh -o   # To start the Optional Services
Generated Reports URL displays error 404
Symptom: Generated Reports URL on CMS displays error 404.
Possible Cause: JReports container not launched in the same worker node as the Client service (NGINX) in the On-prem Kubernetes environment.
Recommended Actions: Make sure that the JReports pod is launched in the same worker node as the Client service pod using the Node selector.
Report Template Not Found error in CMS
Symptom: The error, “Report template not found” is displayed in CMS while scheduling a report
Possible Cause: The report template may not be refreshed
Recommended Actions: Ensure that the template is refreshed using the REFRESH REPORTS option by expanding Report Settings after navigating to Administration > Configurations in left navigation pane of CMS
Report Server Connection error in CMS
Symptom: The error, “Unable to connect to the Report Server” is displayed in CMS while scheduling a report
Possible Cause: Occurrence of SQL connectivity error in the JReports Server
Recommended Actions: Execute the below commands:
- Verify the logs for the Connection error using the command:
docker ps | grep jreport   #To procure Container id
docker logs -f <containerid>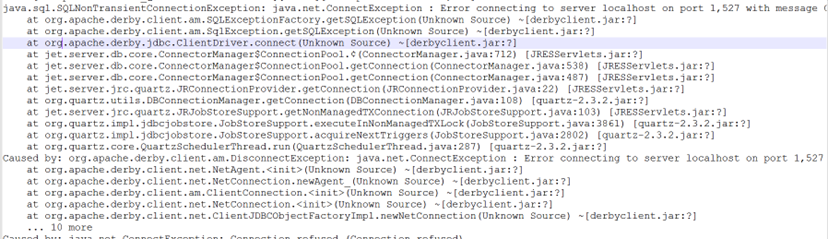
- If the above exception is noticed in the logs, restart the server using the command:
docker restart <containerid>
Optional Services not available on CMS
Symptom: Optional Services (like report, ticket-zendesk, organization) are not available after CMS upgrade and Mongo DB restart
Possible Cause: The running status of the optional services are maintained as flags in a MongoDB collection. These flags are reset to false during Mongo DB restart to modify the service flags to their initial state. Subsequent start of services during CMS start updates the flags to the right state
Recommended Actions: Restart the reports service using the below commands:
- Execute the below commands to note the Container IDs
docker ps | grep report docker ps | grep ticket-zendesk-service docker ps | grep organization-service - Execute the below command to restart reports service
docker restart <containerids>
Stale Licenses Exception Encountered
Symptom: Not able to acquire VSP licenses with the Provision service logs displaying Stale Licenses exception
Possible Cause: The Trust store is corrupted
Recommended Actions: Restart the Provision service container using the commands:
docker ps | grep provisioning-service  #To procure Container ID
docker restart <provision-service-containerid>
Feature Not Found Exception Encountered
Symptom: Not able to acquire VSP licenses with the Provision service logs displaying Feature Not Found exception
Possible Cause: The Trust store is corrupted
Recommended Actions: Restart the Provision service container using the commands:
docker ps | grep provisioning-service
docker restart <provision-service-containerid>
On-prem License Server Error
Symptom: On-prem license server displays the below error while uploading the file cparquest.bin
Recommended Actions:
- Execute the commands below to resolve the issue
docker-compose -f docker-compose-cms.yaml -f docker-compose-cms-optional.yaml stop licenseserver docker-compose -f docker-compose-cms.yaml -f docker-compose-cms-optional.yaml rm -f licenseserver docker-compose -f docker-compose-cms.yaml -f docker-compose-cms-optional.yaml up --no-start licenseserver docker-compose -f docker-compose-cms.yaml -f docker-compose-cms-optional.yaml start licenseserver - Generate and upload the file cparquest.bin
On-prem License Server Data lost
Symptom: Existing license information is lost from On-prem License server in VM CMS and On-prem Kubernetes environment. This occurs after license server container restart or CMS upgrade. It impacts Application provision process and VSP-Host mode enablement
Possible Causes: On-prem license server does not persist the license data. Hence the data is lost.
Recommended Actions: Licensing needs to be re-enabled in the On-prem license server
Cloud License Server not Reachable from Worker Node
Symptom: Cloud License Server is not reachable from Worker Node using the ping command
Possible Causes: This is due to DNS resolution issues
Recommended Actions: Resolve the DNS issue by working with Customer IT support team. Once the CLS host (flex1298.compliance.flexnetoperations.com) is reachable from worker node, restart the provision service container.
CMS Installation takes Long Duration
Symptom: CMS Installation is not progressing for long duration
Possible Causes: Disc space is not available on the Worker node
Recommended Actions: On Worker node execute the commands below:
- To determine /var partition size:
df -h - If /var partition size is more:
- Delete the unused Docker images
- Remove the messages using the below command:
rm -rf /var/log/messages/*
Probe unable to Connect to CMS
Symptom: Probe is unable to connect to CMS. Probe is in disconnected state due to the error “502 Bad Gateway“
Possible Causes: The service cms-client is not responding
Recommended Actions: Restart the service cms-client using the command:
docker restart <cms-client service container id>CMS Pods in Pending status
Symptom: CMS Pods are in pending state after the AWS worker node is restarted
kubectl get pod -n virsecPossible Causes: This can occur when the worker node spans across AWS regions and there are no worker nodes in the same availability zone where the earlier storage classes were created
Recommended Actions: Follow the below steps:
- Log in to the Client Machine and modify the file: <CMS_Directory>/infra/vsp_mongo_pvc.yaml
- Uncomment the lines in the StorageClass section
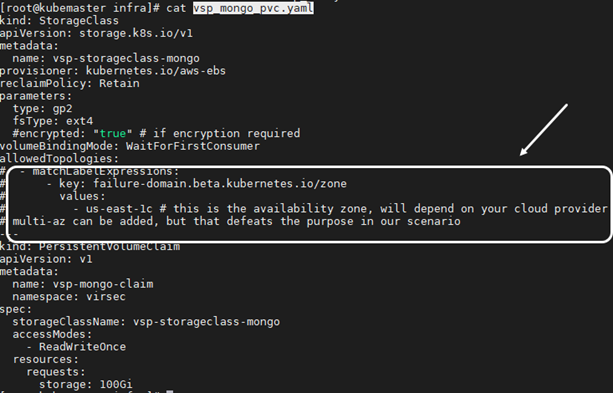
- Add the correct values in values section. Replace the region us-east-1c with appropriate values
- Uncomment the lines in the StorageClass section
- Execute the commands below:
echo '1' > /proc/sys/net/bridge/bridge-nf-call-iptables
echo '1' > /proc/sys/net/ipv4/ip_forward
CMS Pods in CrashLoopBackOff error
Symptom: CMS Pods are in CrashLoopBackOff error
Possible Causes: The worker node may be restarted. Execute the below command to check the values of the iptables flags. The values are 0 or 1
cat /proc/sys/net/bridge/bridge-nf-call-iptables
cat /proc/sys/net/ipv4/ip_forward
Recommended Actions:
- Execute the below commands:
echo '1' > /proc/sys/net/bridge/bridge-nf-call-iptables echo '1' > /proc/sys/net/ipv4/ip_forward - Restart CMS
OutOfMemoryError while listing Kafka Topics
Symptom: When Secure Kafka Mode is set to “1” OR “2”, OutOfMemoryError is encountered while listing Kafka topics using the below command in the directory: /opt/kafka/bin
./kafka-topics.sh --list --bootstrap-server localhost:9093Possible Cause: It is a known issue with the Kafka Client
Recommended Actions: Execute the command below to list the Kafka topics in the directory: /opt/kafka/bin
./kafka-topics.sh --zookeeper zookeeper.virsec.com:2181 –listDebugging Kafka Topics
This section provides commands for general Kafka Topic debugging:
- Execute the command below to navigate to the Kafka bin directory:
cd /opt/kafka/bin - Execute the below command to list any pending messages:
./kafka-consumer-groups.sh --list --bootstrap-server localhost:9092 #To Procure Group Name kafka-run-class.sh kafka.admin.ConsumerGroupCommand --group <Group_Name> --bootstrap-server localhost:9092 --describe- The column “LAG” indicates the pending messages in the topic
- Example: The command for Process Monitoring related incidents:
kafka-run-class.sh kafka.admin.ConsumerGroupCommand --group PROCESS-MONITORING-SERVICE_9de241f5-62e9-415d-85da-2cfe0a35af4b --bootstrap-server localhost:9092 --describe
- To list the Kafka topics, utilize the commands below:
- Secure Kafka Option "0" (Only for Version 2.7)
./kafka-topics.sh --list --bootstrap-server localhost:9092 - Secure Kafka Option "1" or "2"
./kafka-topics.sh zookeeper zookeeper.virsec.com:2181 –list
- Secure Kafka Option "0" (Only for Version 2.7)
Was this article helpful?